Understanding Cut, Fill, Net Volume, and Elevation Statistics in Drone Stockpile Measurement
What Do These Terms Mean for Stockpile Measurement?
When you measure a stockpile of material - whether it is gravel, sand, coal, or earth - you are essentially trying to answer a simple question: how much material is there? But the answer is rarely a single number. Instead, it comes from comparing two surfaces: the current surface of the pile and a reference surface, usually the ground beneath it or a target elevation. The terms cut, fill, net volume, and elevation statistics are the building blocks of that comparison. Understanding them helps you make sense of any volume report from a drone survey.
Drone stockpile measurement has become the standard method for many operations because it is fast, safe, and accurate. Instead of walking over a pile with a GPS pole or using a loader to weigh every truck, you fly a drone overhead, capture overlapping images, and process them into a three-dimensional model. That model is then compared to a reference surface to calculate volumes. The numbers you get - cut, fill, net volume - tell you what has changed and by how much. A platform like National Drone Services can handle the data processing and comparison for you, turning raw aerial images into clear volume reports.
What Is Cut?
Cut is the volume of material that has been removed from a site. In a stockpile context, cut usually refers to the volume of material that is above the reference surface. If you start with a flat piece of ground and dump a pile of sand on it, the cut is the volume of sand that sits above the original ground level. More practically, if you take a measurement at the start of a week and then again after a week of hauling away material, the cut is the volume that is now missing - the amount that was taken out. In a volume report, cut is often shown as a positive number because it represents material that has been excavated or removed from the stockpile site.
What Is Fill?
Fill is the opposite of cut. It is the volume of material that has been added to a site, filling in areas that were lower than the reference surface. If you dig a hole and then backfill it with gravel, the gravel that sits below the original ground level counts as fill. In stockpile measurement, fill might represent material that has been dumped into a containment area or used to build up a foundation. In a volume report, fill is often shown as a negative number because it represents material that has been added to the site, lowering the net volume if you are tracking removal.
It is important to note that cut and fill are not the same as removal and addition in every workflow. Some reports treat cut as positive and fill as negative. Others swap the sign. Always check the convention your software uses before making decisions based on the numbers.
What Is Net Volume?
Net volume is simply the cut volume minus the fill volume (or the other way around, depending on the software's sign convention). If you remove 100 cubic meters of gravel from one end of a site and dump 30 cubic meters of it into a hole at the other end, your net volume is 70 cubic meters. That net number tells you the overall change in material quantity on the site. For stockpile management, net volume is the key figure for reconciling inventory, checking whether material has been lost or stolen, or verifying that the amount delivered matches the amount received.
Net volume is also used to compare two surveys of the same pile over time. If you survey a coal stockpile on Monday and again on Friday, the net volume change tells you how much coal was used or added during the week. A positive net change means more material was added than removed; a negative net change means more was removed than added. In a busy yard, tracking net volume week over week helps you spot discrepancies early.
Elevation Statistics: The Foundation of Volume Calculations
Elevation statistics are the raw data behind every volume calculation. They describe the shape of the surface: the highest point, the lowest point, the average elevation, and the range of elevations across the stockpile. These numbers are important because they tell you whether the survey captured the whole pile and whether the reference surface is appropriate.
For example, if your stockpile has a maximum elevation of 12 meters and your reference surface is set at 10 meters, you will miss the top two meters of the pile in the cut calculation. Conversely, if the minimum elevation of the pile is lower than the reference surface, you will get fill volumes where there is none. Good drone stockpile measurement software automatically checks these statistics and highlights potential errors. It can also generate a color-coded map showing which areas are cut (above reference) and which are fill (below reference).
How Drone Data Produces These Numbers
The process starts with a drone flight. The drone takes hundreds of overlapping photos of the stockpile from different angles. Those photos are processed using a technique called photogrammetry, which stitches them into a three-dimensional model called a digital surface model (DSM) or a point cloud. The model contains millions of elevation points, each with an X, Y, and Z coordinate.
Once the model is built, you define a reference surface. This can be the ground elevation before the pile was placed, a flat plane at a certain height, or a surface from a previous survey. The software then compares every point in the new model to the reference surface. Points above the reference are counted as cut; points below are counted as fill. The volume of each is calculated by summing the differences across the entire area. The result is a report that shows cut volume, fill volume, net volume, and a variety of elevation statistics.
Accuracy depends on several factors: the quality of the drone photos, the number of ground control points used to calibrate the model, and the resolution of the reference surface. A good survey will include a few check points measured with a GPS to validate the model's elevation accuracy. Without those, the reported volumes might be off by several percent.
What These Statistics Mean for Your Operation
Understanding cut, fill, net volume, and elevation statistics helps you answer practical questions. How much material left the site this week? Did we receive the full shipment? Is the pile settling or shifting? Are we losing material to theft or spillage? Each of these questions requires a different interpretation of the numbers.
For inventory reconciliation, net volume is usually the most important figure. But it is also worth looking at the cut and fill numbers separately. If the net volume is small but the cut and fill numbers are both large, it means material has moved around the site a lot. That could indicate rehandling, which adds cost. If the net volume is large in one direction, it may mean material is being removed faster than expected, or that the pile is being built up for a project.
Elevation statistics help you spot data quality issues. If the maximum elevation of the pile is suspiciously high compared to the rest of the pile, it might be a bird or a piece of equipment that got caught in the photos. If the minimum elevation is much lower than the ground around the pile, it might mean the drone did not capture the full base of the pile. Checking these statistics before you trust the volume numbers is a good habit.
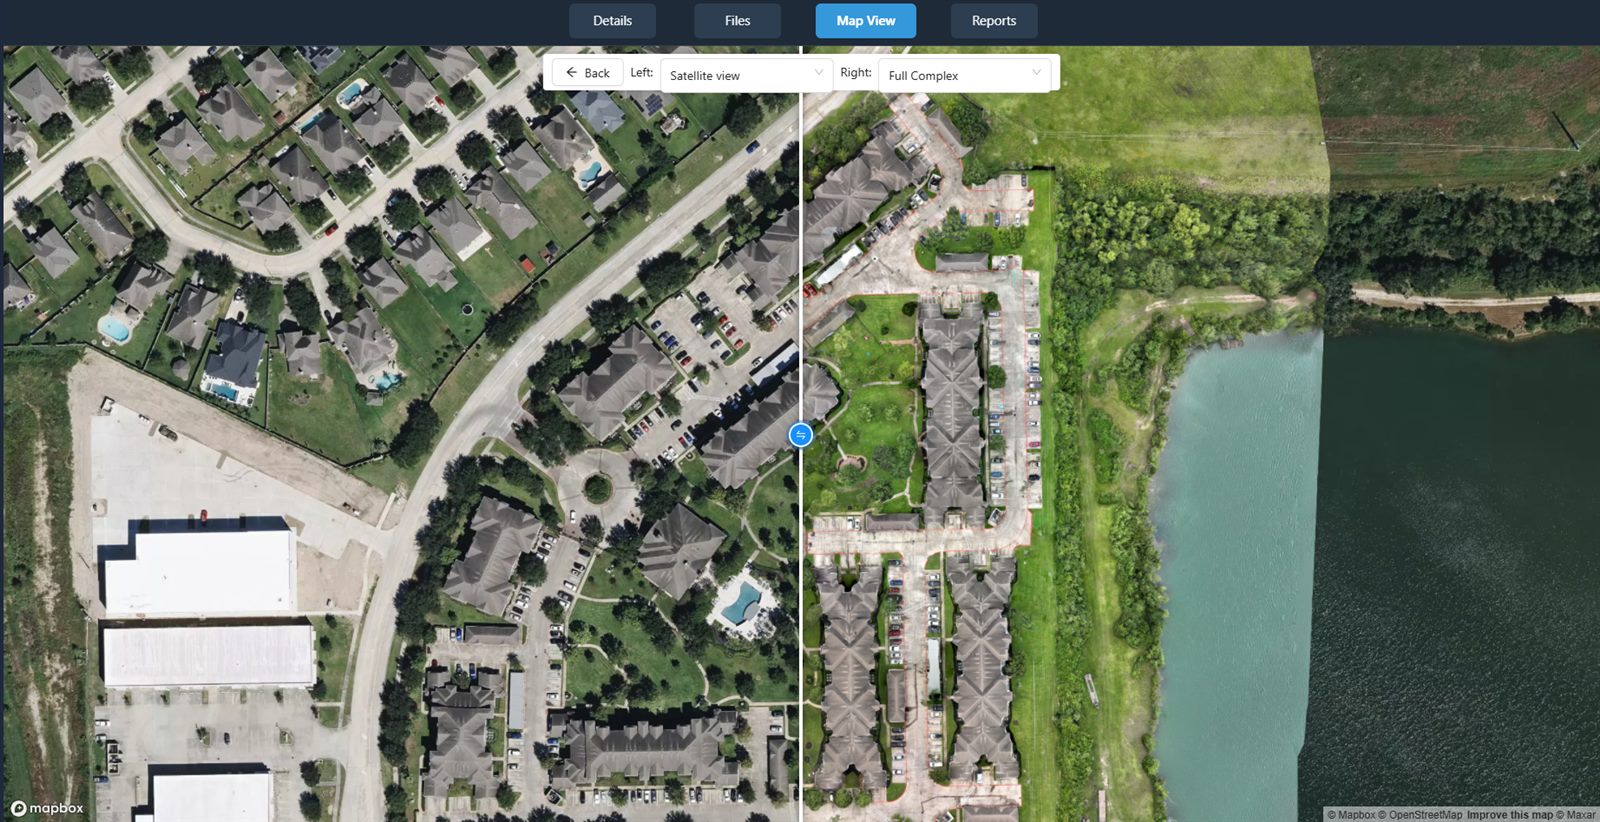
Many drone data processing platforms, including National Drone Services, display these statistics in a dashboard so you can review them quickly. You can compare two surveys side by side, see the cut and fill volumes, and check the elevation range at a glance. This makes it easy to catch errors early and avoid making decisions based on bad data.
In short, cut, fill, net volume, and elevation statistics are not just technical terms. They are the language of volume measurement. Once you understand what each one means and how it relates to the others, reading a drone survey report becomes straightforward. You can see not just how much material is there, but also how it is distributed, how it is changing, and whether the data is reliable enough to act on.
National Drone Services on social media
 Facebook